ELECTION FEATURE: Red, Blue, or Purple?
despite shifting voting patterns, the Chippewa Valley remains a sought-after swing area on Election Day
Luc Anthony, photos by Andrea Paulseth |

Wisconsin likes to vote. The Badger State’s turnout rates are regularly among the highest in the United States, particularly in presidential election years. Western Wisconsin is the same, anchored by the population center of the Eau Claire metropolitan area. One can speculate on the reasons: ancestry, continuously competitive races, that “Upper Midwestern work ethic” displayed in an obligation to cast a ballot. Regardless, when our area votes, you realize that the result reflects the sentiment of the landscape. The evolution of that sentiment in the western part of the state makes for a compelling case study. What a half-century ago was considered Democratic territory may be settling into comfortably Republican zones, while former pockets of urban GOP strength are now a shade of electoral navy blue – or perhaps not. Meanwhile, approximately two-fifths of voters are prone to swing from party to party and candidate to candidate, from election to election. Does the recent history of voting patterns in Eau Claire and the Chippewa Valley give us insight on what we will see very late on the night of Election Day 2016 as the returns are tabulated? Inspired by “Dividing Lines,” a 2014 investigative series by the Milwaukee Journal Sentinel detailing the sharp geographical voting differences in the Milwaukee area, this article will demonstrate that our region features more of a political and ideological blend – and is certainly politically complicated.

On the Fence
The broad American political dynamic of the 2010s is apparent when you observe how the two dominant political parties have fared in local urban and rural settings: Cities tend to be won by Democrats, lesser-populated regions oftentimes by Republicans. Combine the cumulative shifting nature of the northwestern quadrant of Wisconsin with similar patterns elsewhere in the state, along with the staunchly liberal urban population cores of Madison and Milwaukee and their conservative polar opposites in the suburban Milwaukee “WOW” (Waukesha, Ozaukee, and Washington) counties, and you have a state with many an election resulting in each party receiving nearly 50 percent of the tally. Motivating waves of die-hard partisans to vote helps win an election, but getting the not-so-partisan residents of our area to stick with your side is the understated tipping point in who becomes our governor, our senators, and the recipient of our presidential electoral votes.
John Frank knows his voters. Once an aide to former U.S. Rep. Steve Gunderson, R-Osseo, Frank is currently an instructor at Chippewa Valley Technical College, and has decades of observations on the makeup of our regional demographics. Those years of experience have taught him that – contrary to nationwide speculation that we have settled into equal camps supporting each party – many of us are ultimately independent in our political identity. He speculates anywhere from 40-45 percent of the western Wisconsin electorate would not truly identify themselves with a party. “How else do you explain that in 2008 and 2012, the state and, certainly, this area, votes for (Democratic President) Barack Obama, and then in 2010 and 2014, the state and, again, this area, with the possible exception of Eau Claire County – which was so close that somebody could have asked for a recount – they voted for (Republican Gov.) Scott Walker?” Frank said. “How do you explain that, other than to say, ‘There are lot of people who are politically independent?’ ”
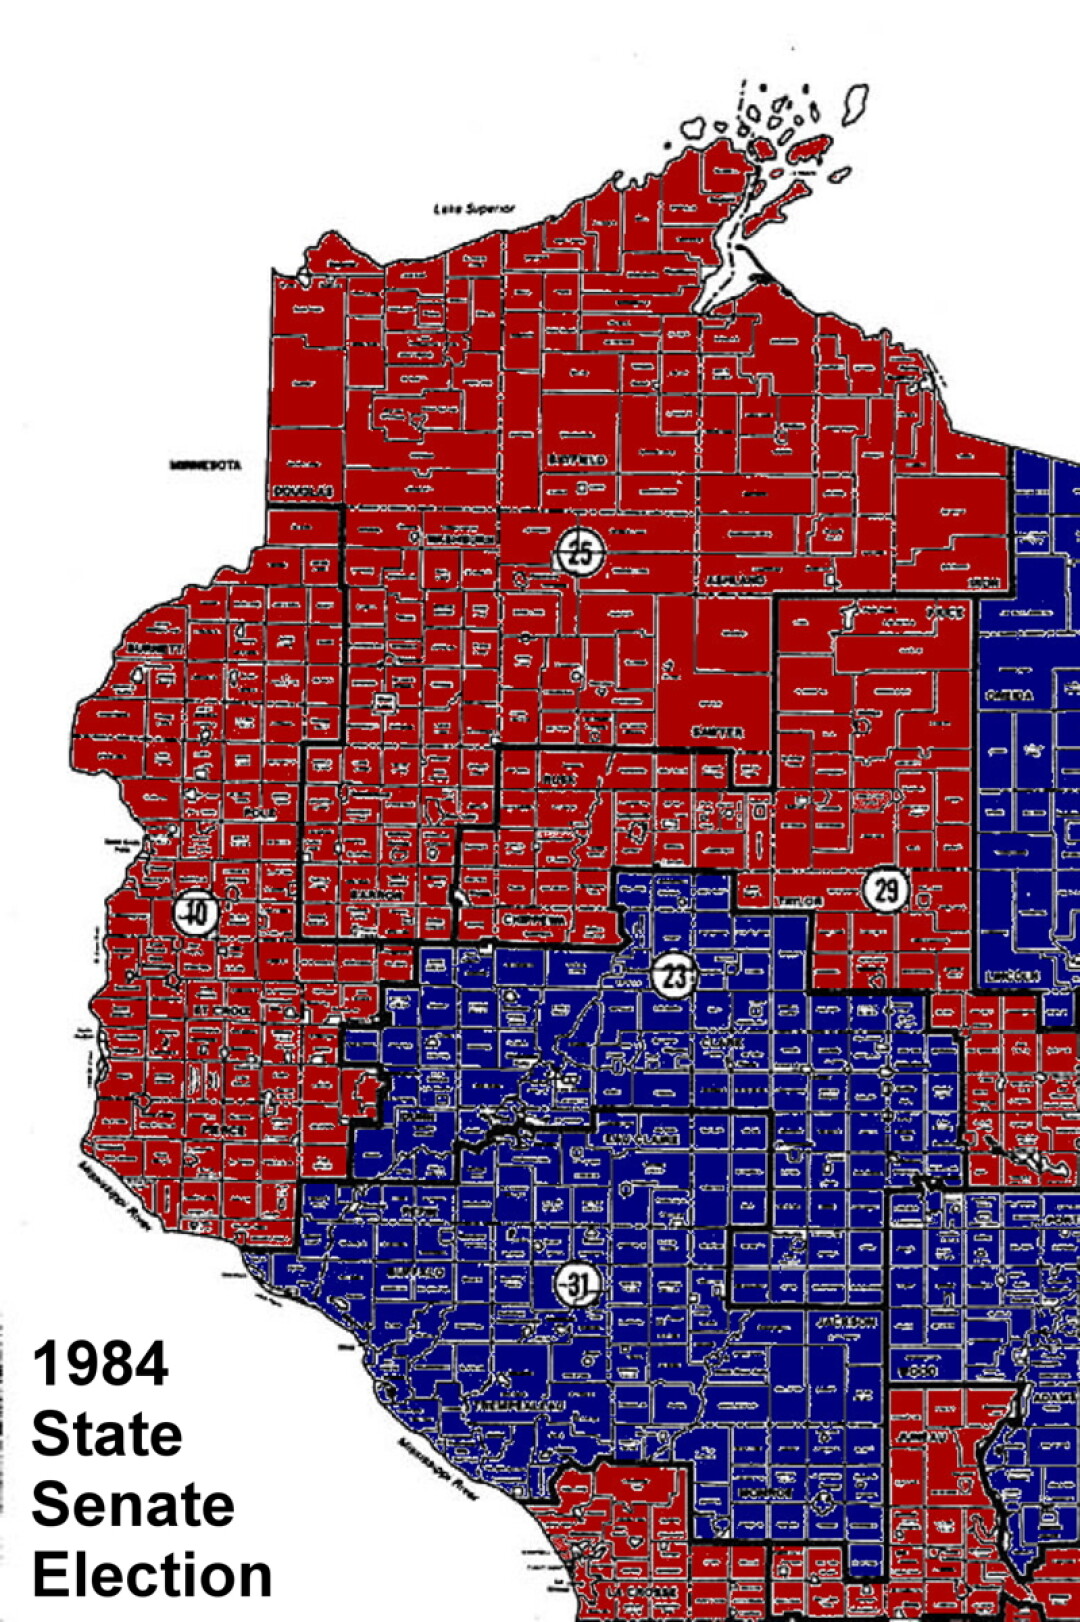
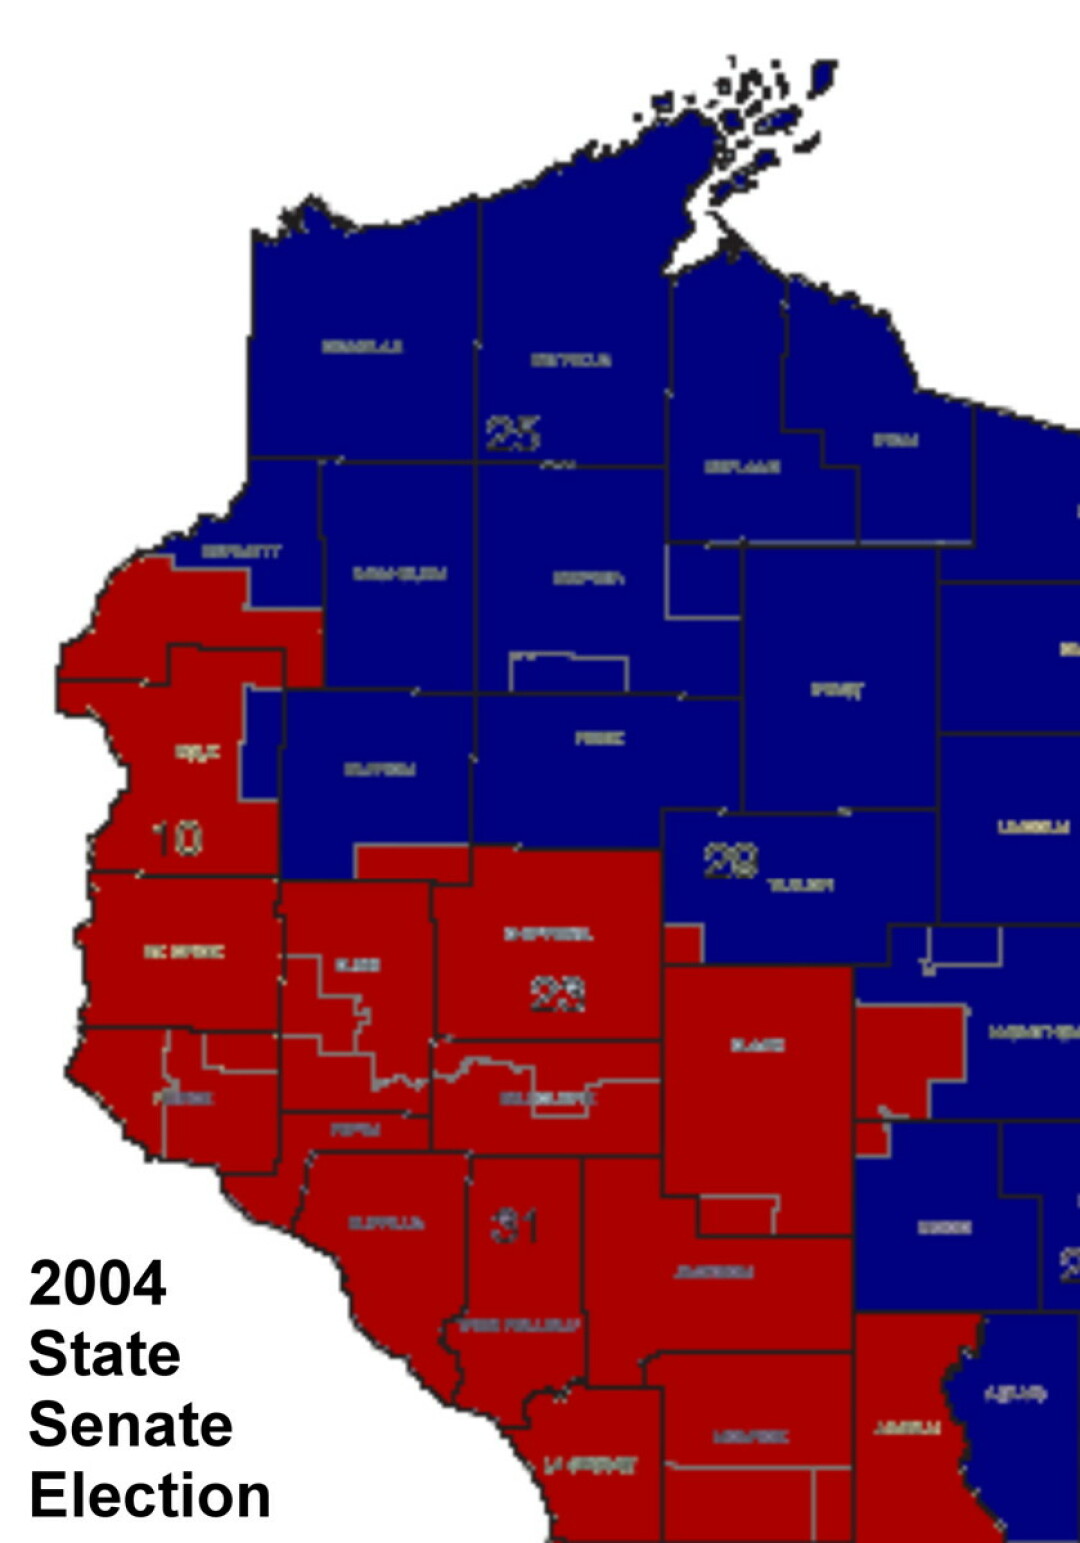
Witness the vacillation of Assembly and State Senate party control by district. As Frank pointed out, 1977 featured a sea of blue across the farm fields of the region; by 2003, those fields had turned a shade of red. In the mid-1960s, Thomas Barland – you may know him as a longtime Eau Claire County judge – represented an Assembly district consisting of the city of Eau Claire. Barland was a Republican. Today, Dana Wachs represents a similar Assembly district consisting of the city of Eau Claire. Wachs is a Democrat. As Dr. Robert Gough, professor emeritus at UW-Eau Claire notes, “In 1956, it was actually the parts of the county outside of the city which were more Democratic.”
Even so, western Wisconsin has not been immune from the ongoing settling of conservative voters into the Republican Party and liberal voters into the Democratic Party across the United States. Frank notes how liberal-to-moderate Republicans began to feel out of place with their party; the same trend affected conservative-to-moderate Democrats. The sentiment of these voters? “You weren’t as welcome as you used to be.”
This transition can be seen in the aforementioned urban/rural movement. With regard to the 1956 example, Gough notes that the rural support for the Democrats may have reflected “the Progressive inheritance in the farm community, which is now virtually gone in the county.” Evidence of this trend can be seen across the border in Minnesota. Gopher State Democrats are officially known as the Democratic-Farmer-Labor Party, which has roots in a 1940s merger of urban Democrats with the social democratic Farmer-Labor Party that drew its strength from, well, farmers. Today, much of Minnesota’s farmland is deepening its hue of Republican red as the DFL now depends primarily on city and suburban voters to win elections.
The Big Shift
To diagnose the shift of some Chippewa Valley voters to better align their ideology with a more-appropriate party, you need to consider the factors that have been particular to this region within the past half-century. A tire plant closure, the annual deer hunt, and the choice of your degree and residence can explain much of how our voting patterns have evolved throughout the election cycles.
Frank cites three factors for a type of conservative voter choosing a different party:
One: the presidency of Republican Ronald Reagan, who appealed to a working class demographic known as Reagan Democrats. “All of a sudden, people found out that – who had voted Democrat because they had been told they should be voting Democrat by ... their union – suddenly it’s not a sin to (vote Republican) anymore,” he said.
Two: the closure of the Uniroyal tire plant in 1992, and the consequent loss of a strong area labor union to encourage employees to vote Democratic for economic reasons, despite where those voters sat on the ideological spectrum.
And three: With the decline in emphasis on so-called pocketbook issues, cultural factors gained importance. Frank notes one subject in particular that has arisen in prominence this century: “The big issue around here is: Everybody likes to go hunting. And which party is more receptive to being pro-gun?” he asked. The answer: the Republican Party.
Simultaneously, another factor has driven changes in our electoral makeup – an individual’s educational attainment. In this year’s presidential race, much has been said about the divided appeal of Hillary Clinton and Donald Trump to college- and non-college-educated voters. At least in Eau Claire, Gough believes that this trend explains how a distinct area like the Third Ward east of the UW-Eau Claire campus has performed a full switch in its electoral tendencies to become one of the most-reliable Democratic wards in the state. Gough observes “the influence of educational levels in making professionals in all occupations (and who therefore tend to appreciate historic homes) more leftish (think how conservatively doctors voted in 1956 – now most vote Democratic, despite their income levels). These professionals are now more commonly residents of the Third Ward than the businessmen who dominated it in 1956.”
University and college towns, and their home counties, can be seen as blue dots across the United States, even in broadly Republican zones like the South. However, while Blugold students are more likely than not to vote for Democrats, the tendency isn’t as strong as one might imagine.
There is yet another factor explaining the lack of usual political norms in the Chippewa Valley: the students of UW-Eau Claire. University and college towns, and their home counties, can be seen as blue dots across the United States, even in broadly Republican zones like the South. However, while Blugold students are more likely than not to vote for Democrats, the tendency isn’t as strong as one might imagine. As a professor at UW-Eau Claire, Gough figures this is due to a combination of a student body that is more than 90 percent white (in modern politics, whites overall vote more for Republicans than do other ethnicities), more-affluent students from Minnesota coming to study here (though he notes some evidence that their arrival in the 1990s and 2000s actually liberalized voting results), and – more-recently – Gov. Scott Walker’s promotion of a UW System tuition freeze.
Partisan Geography
These are the explanations for why we vote the way we vote. Looking towards the 2016 election – and elections in the future – what are the wards and subsets of communities to follow, the patterns of partisanship, and the places to watch that can explain who will win the most votes?
The primary population center of western Wisconsin, Eau Claire, has often voted more Democratic than the broader region or Wisconsin as a whole. For a time, according to Frank, “when Democrats win, it’s usually – in a town like Eau Claire – it’s a coalition of conservative union types and liberal university types.” The decline of unions and the attendant departure of some such members across the country has been offset in Frank’s view by the presence of university faculty. When you add Gough’s take on professionals increasingly leaning to the left, you see why in presidential elections since 2000 the city has voted about eight points more Democratic than the state has.
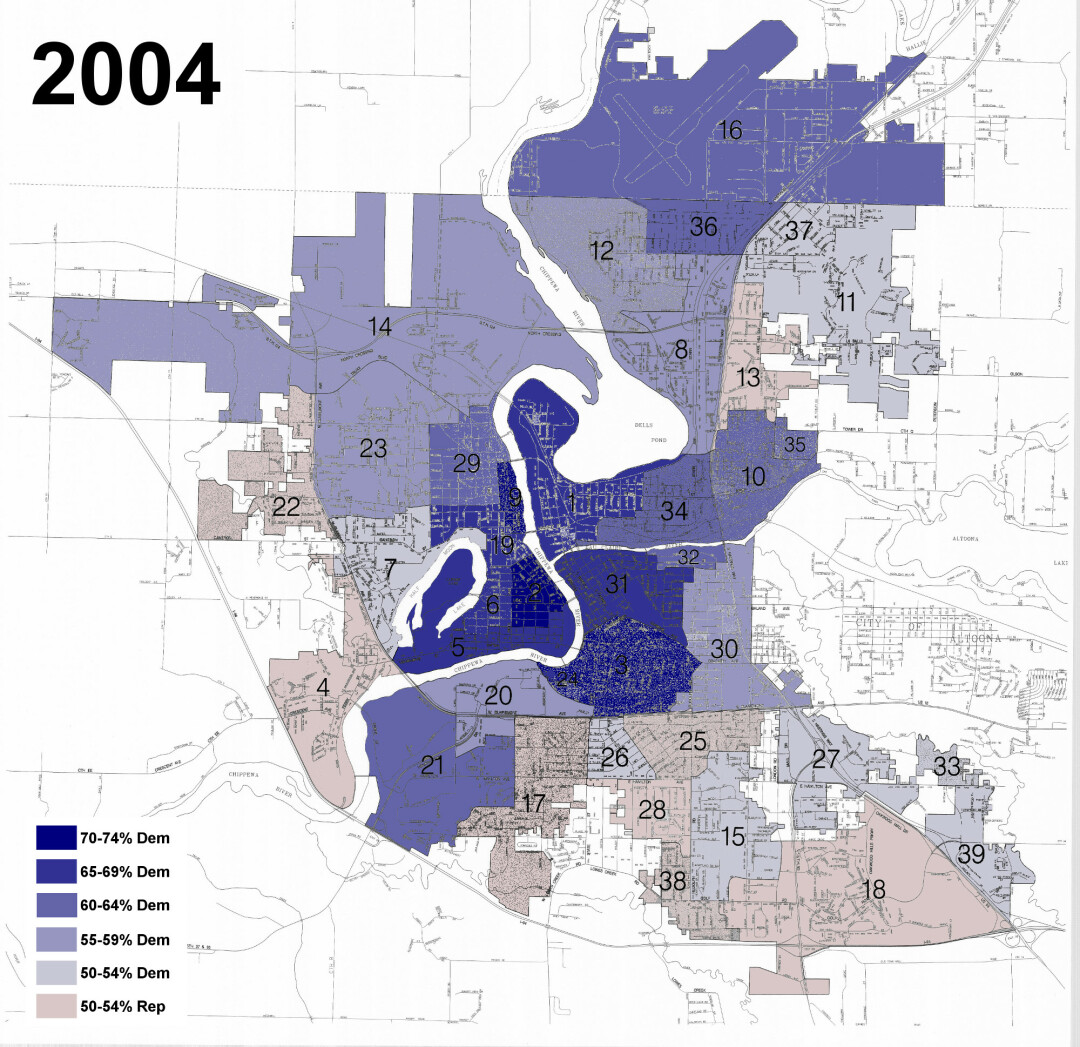
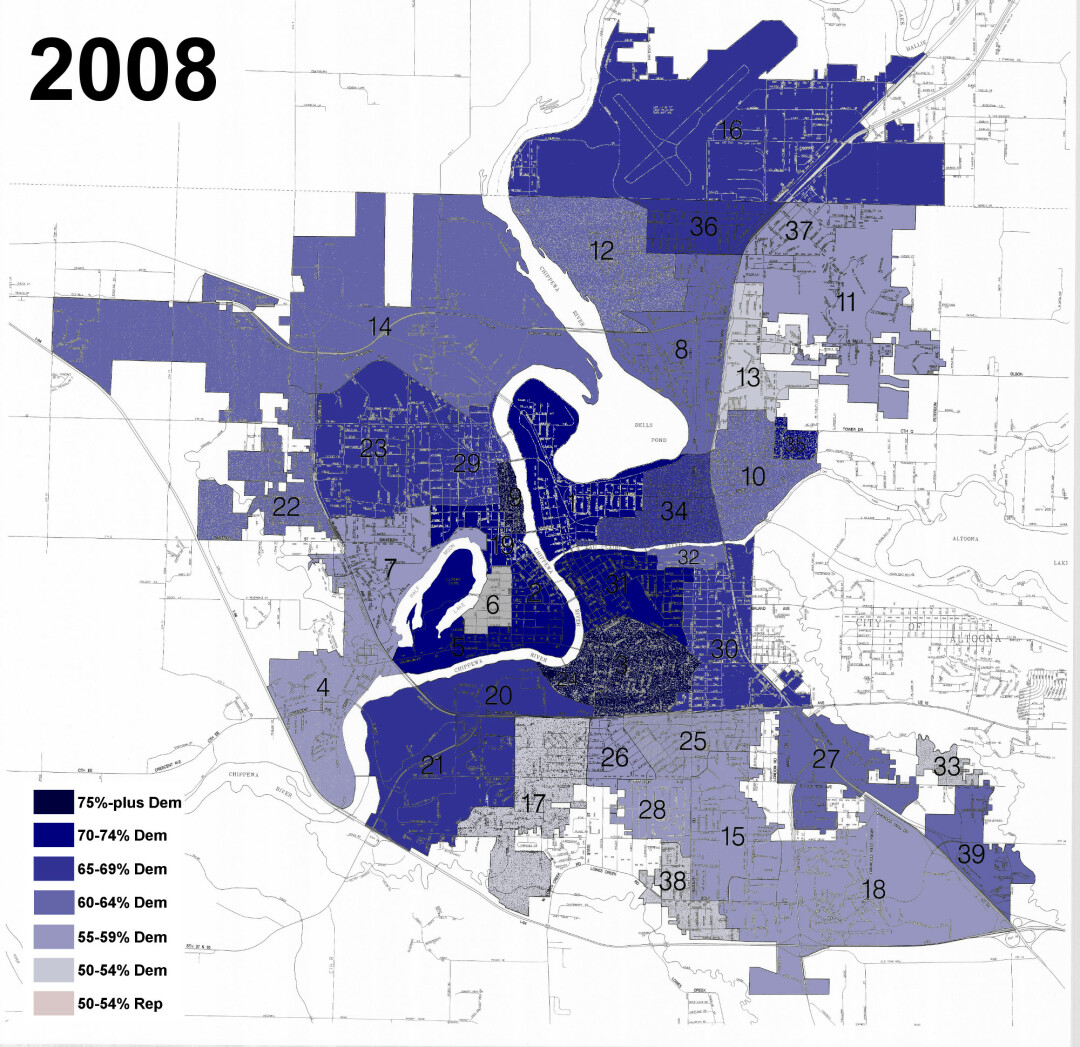
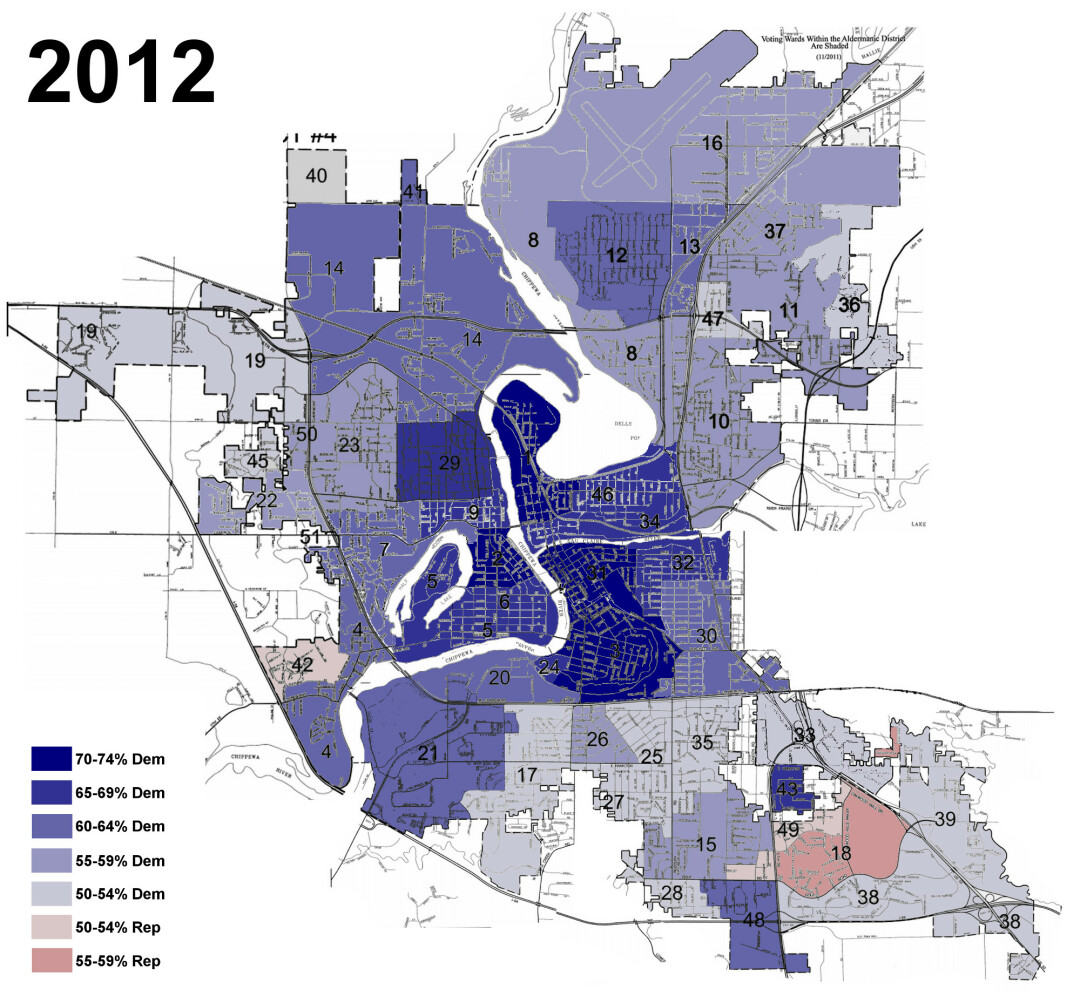
Inside Eau Claire, that Democratic strength is most-concentrated in the following locations: the aforementioned Third Ward; the general North Side and Eastside Hill neighborhoods (as Frank notes, this is where 20th century rubber worker union residents historically boosted Democratic vote margins, and you can see that influence in the patterns of their modern-day descendants); and the Lower West Side (the former home to paper mill workers, with a similar patterns to the rubber worker union areas). At least in recent election cycles, Republicans are lucky to get above 50 percent of the presidential vote in any City of Eau Claire voting ward, though over the decades, most of their success has been found in pockets of post-World War II development near the airport and in the half of the city south of Clairemont Avenue. As Frank stated, younger professionals established a 55-65 percent Republican vote in those segments of the city, although as time has passed, this has trended in the direction of a 50-50 split. Looking at maps from very recent elections, the reddest parts of Eau Claire itself are mainly in newer southeastern development near Oakwood Mall. Yet the preponderance of Democratic areas means most candidates from that party will win the city vote – perhaps even extended to City Council and school board candidates and referendums broadly favored by liberals and the Democrats, even with the presence of numerous independent-minded residents.
Predicting Patterns
Any individual election can be decided on the strengths and weaknesses of one particular candidate, a statewide or national wave, a scandal, or even a snowstorm. To account for extenuating circumstances in a given year, one would be wise to look additional cycles into the future to discern the coming political trends of the Chippewa Valley. Will cities turn bluer and rural settings redder, or will the colors continue to alternate back and forth?
“I’ve told people (representing national candidates) when they say, ‘Well, we wanna come and campaign in your area.’ And I said, ‘You better spend some time.’ Because, in western Wisconsin, people want to shake your hand and look you in the eye.” – John Frank, political analyst
Frank is of the opinion that our independent streak will remain the Valley’s defining political characteristic. In his view, our mostly Scandinavian and German ancestry leads us to say to prospective office holders, “You gotta prove it to me.”
“I’ve told people (representing national candidates) when they say, ‘Well, we wanna come and campaign in your area.’ And I said, ‘You better spend some time,’ ” he noted. “Because, in western Wisconsin, people want to shake your hand and look you in the eye.”
While noting the difficulty of future political prognostication, Gough acknowledged a possible statewide trend towards the Republican Party due to the state’s mostly white population. “Regionally, this trend can already been seen to the north of Eau Claire in the Chippewa Valley, in Barron and neighboring counties, and to a lesser extent to the south, in Trempealeau County,” he said. For Democrats to remain competitive beyond their base of the Madison area, he sees their “need to grow the Democratic vote in Eau Claire, La Crosse, Wausau, Green Bay, etc., to offset the gradual decline of the relative importance of Milwaukee in the total statewide vote, and the strong tendency for the rural vote in the state to become Republican.”
Projecting politics is difficult. To again cite Minnesota, the state seemed to be embarking on a decidedly Republican future as recently as 2002 before a return to demonstrable Democratic success and many further shifts around the proverbial political 50-yard line. Obama had one of his best 2008 swing-state performances via his 14-point Badger State victory, yet Walker-era midterm elections can make the state as red as the color of Badgers athletics. And Republican Ron Johnson and Democrat Tammy Baldwin have been among the most ideologically opposite U.S. senators to serve the same state at the same time in modern history.
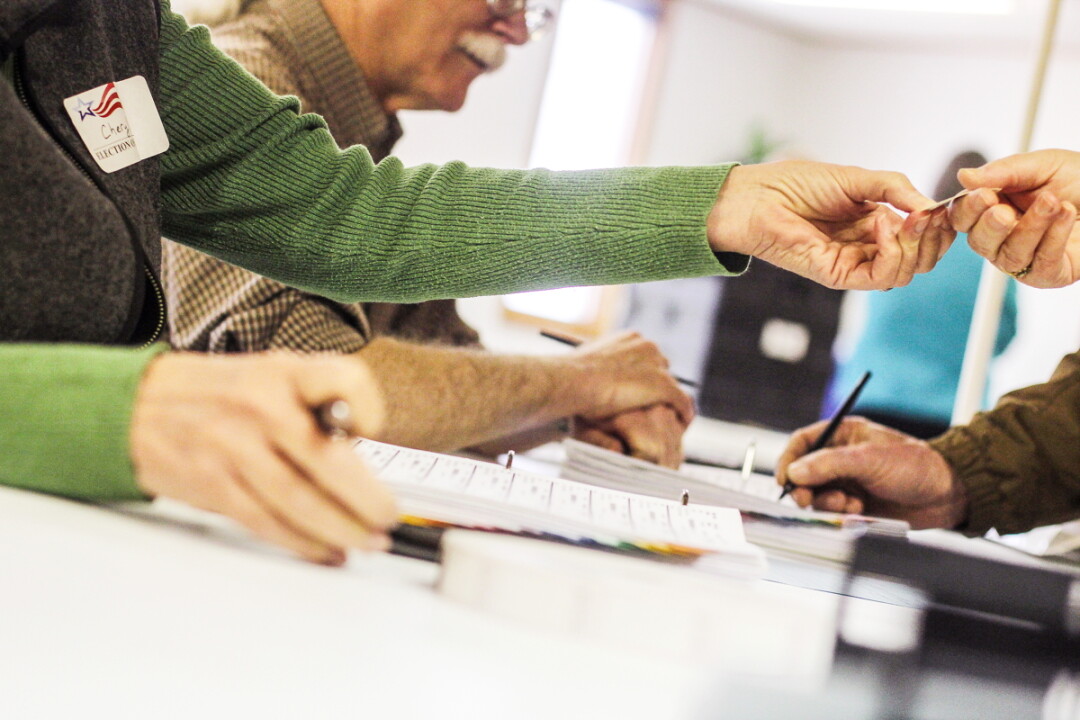
A major national event could shift allegiances further among the parties; a scandal in the state could decimate one or the other. A gradual influx of one or more demographic groups could change our voting patterns without any clear anticipation. Perhaps national projections of a blue coast and Sun Belt and a red Midwest will come to fruition. Perhaps our quirks of heritage and history will keep the Chippewa Valley firmly purple – whether Packers fans like it or not. The only sure winner in western Wisconsin will be the makers of the Scantron electronic paper ballots and felt-tip pens which will be used on Election Day as we in the Chippewa Valley do something more reliably than many in our country: vote.
Mapping Eau Claire's
Presidential VotesBelow are the city of Eau Claire’s presidential vote results by party in three recent elections, marked by aldermanic ward. Deeper shades of blue correspond to wards that voted more Democratic; redder shades voted more for the Republican nominee.
Eau Claire County
Presidential Winners2012 Barack Obama • 2008 Barack Obama • 2004 John Kerry • 2000 Al Gore • 1996 Bill Clinton • 1992 Bill Clinton • 1988 Michael Dukakis • 1984 Ronald Reagan • 1980 Jimmy Carter • 1976 Jimmy Carter • 1972 Richard Nixon • 1968 Hubert Humphrey • 1964 Lyndon Johnson • 1960 Richard Nixon • 1956 Dwight Eisenhower • 1952 Dwight Eisenhower • 1948 Harry Truman • 1944 Thomas Dewey • 1940 Franklin Roosevelt • 1936 Franklin Roosevelt • 1932 Franklin Roosevelt • 1928 Herbert Hoover • 1924 Robert M. LaFollette • 1920 Warren Harding • 1916 Charles Hughes
Mapping Western Wisconsin's
Assembly VotesBelow are five maps showing the results of Western Wisconsin's state Assembly elections at 10-year intervals from 1974 to 2014; blue represents districts won by a Democrat, red by a Republican. Below that, find five maps from the same election years showing which party controlled which state Senate seat following those election cycles. (Not all state Senate seats are up in each election, so not all seats were contested in a given election.)
Mapping Western Wisconsin's
Senate Votes


